We’ve touched on the significance of this once-in-a-lifetime opportunity to fix Hennepin Avenue. It goes beyond just this city-controlled street. What happens here will influence other streets, including county-controlled streets like Franklin, Lowry Ave NE, Lake, Lyndale, West Broadway—streets that currently threaten the health and safety of Minneapolis residents. Many of us involved with Hennepin for People have participated in this process since it started back in 2018. That’s a long time. This is deeply personal to us, it’s where we live. Many of us have had close calls on Hennepin Avenue. It’s not an abstract or philosophical question. This street impacts our daily lives. We can’t accept less than significant pedestrian improvements, along with dedicated space for transit and bikes.
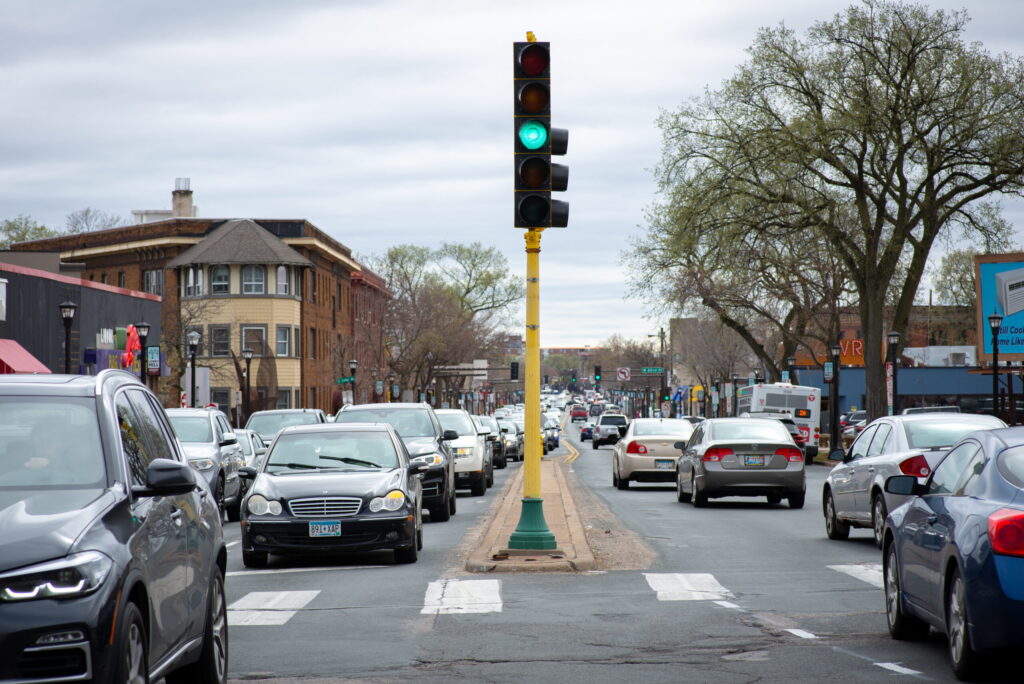
Hennepin Avenue doesn’t work for anyone in its current form. It’s stressful to drivers, it’s a hazard to vulnerable users like pedestrians, bikers and transit users. Our streets need to reflect our values—how we care for our neighbors and for the environment. We are the only inclusive side with a vision. The outcome for Hennepin should be a street that reflects our priorities and ambitious policies like the Transportation Action Plan, Complete Streets, and Vision Zero. A safer, more vibrant street is inclusive and works for drivers, pedestrians, bikers and transit riders.
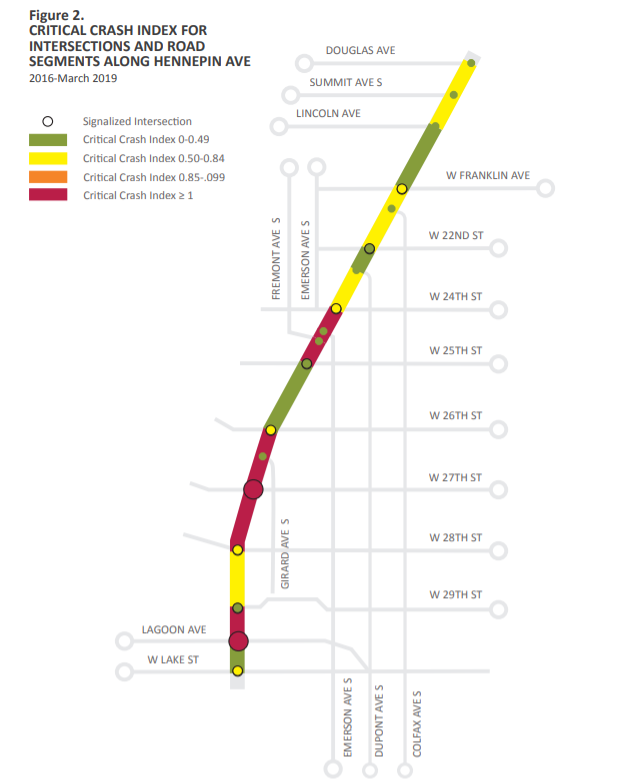
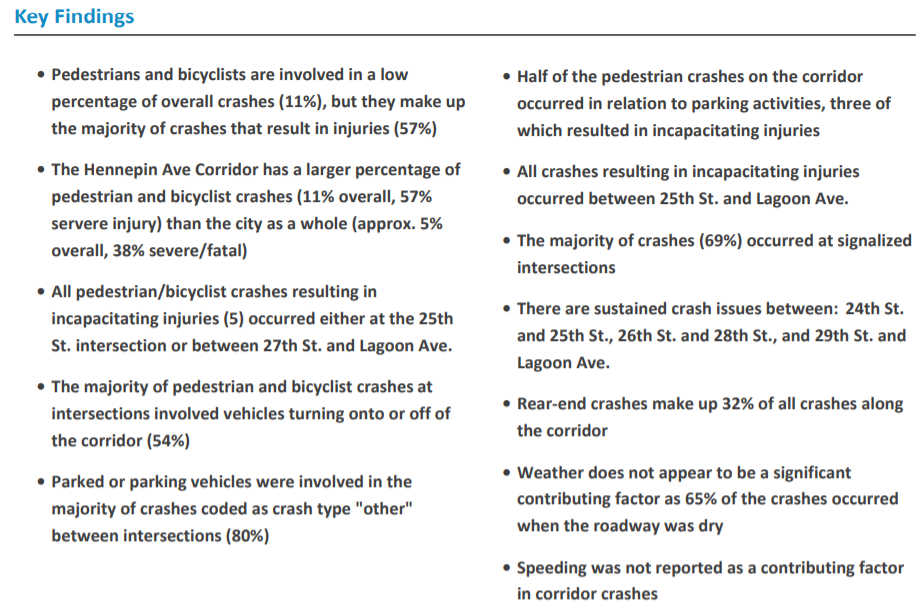
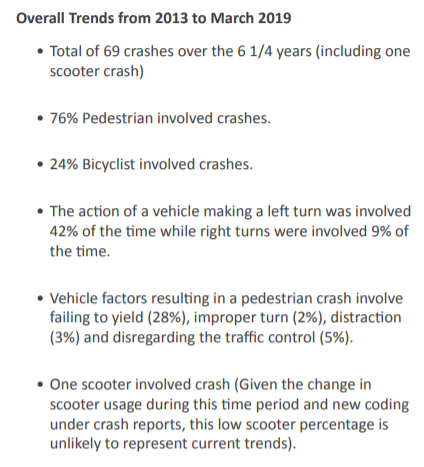
Looking at the City of Minneapolis Crash Study, the takeaway is Hennepin Avenue is a dangerous place for people walking and biking. And this only includes reported incidents. How often do you report a dangerous encounter with a vehicle as a pedestrian or biker?
Here and now, we have an opportunity to change the system with this reconstruction. We can have pedestrian improvements, but only if we prioritize space for people over cars. For transit riders, dedicated bus lanes will bring faster travel speeds and better schedule reliability in congested corridors. Climate change is real and the simple fact is we need to reduce car trips to meaningfully reduce emissions.
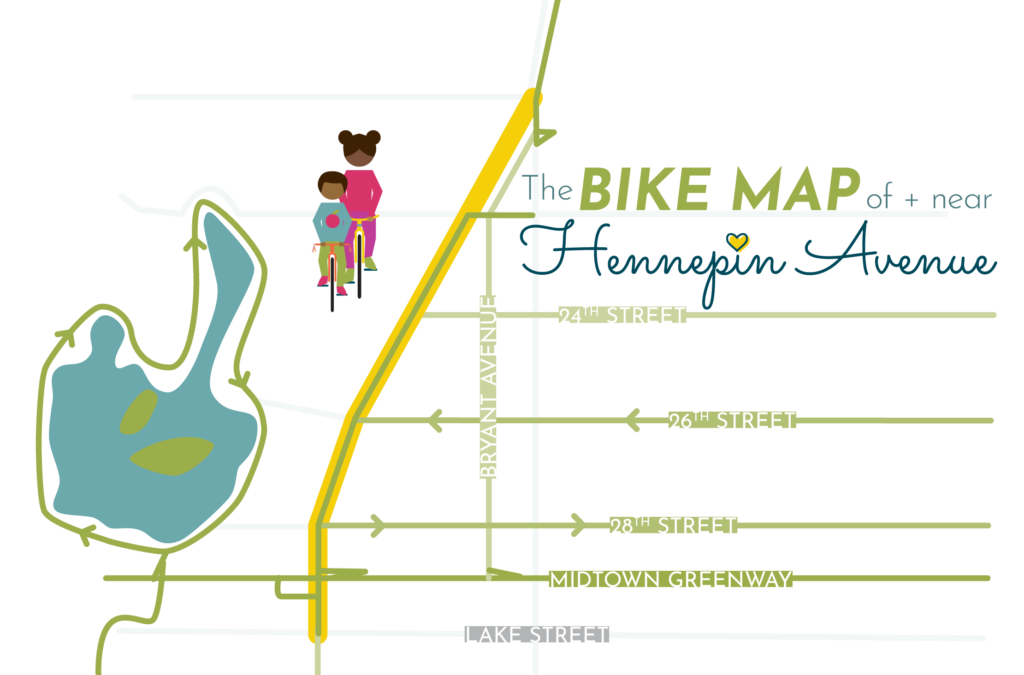
Dedicated space for people biking will encourage more people to travel to the local businesses along Hennepin. With the Greenway, 24th St, 26th St, 28th St, Bryant, and Hennepin we’d have a nice biking network. Students, parents, and teachers at Jefferson School deserve safe routes to bike and walk to school. With the anticipated changes coming to the school district and Jefferson, even more kids will be crossing from the west and north and moving along Hennepin. A raised bike path and pedestrian improvements would mean a safer, more pleasant, less chaotic trip to and from school. You don’t have to bike but you can support other people biking, that means less traffic for you. We can’t all drive in a city, you’d never get anywhere. We have to be forward thinking.
The status quo is a stubborn thing but we can change the system together. Support a street that works for everyone and all the potential that is ahead of us: sign our petition and contact your council member.